Zoomorphic adventures with data animals at the surgical and critical care informatics away day

If data were an animal, what would it be?”
After a full day and a half of talking about data at the strategy away day, it was time for people to get their hands dirty at Doodles pottery for some ‘team-building’. What better occasion to paint our own data animals! Everyone chose an item to paint: a mug, a jug, a bowl, and got to work dabbing, splatting, etching, and painting their designs. Creative activities like pottery painting are said to be good for team building because they nurture trust between colleagues; usually, everyone starts with minimal expertise, which is a good leveller, and everyone makes themselves a little bit vulnerable by putting their creations out into the world. This kind of activity also helps people get in touch with their inner artist and the parts of their brain responsible for creativity, imagination and intuition. This is the birth place of data animals!
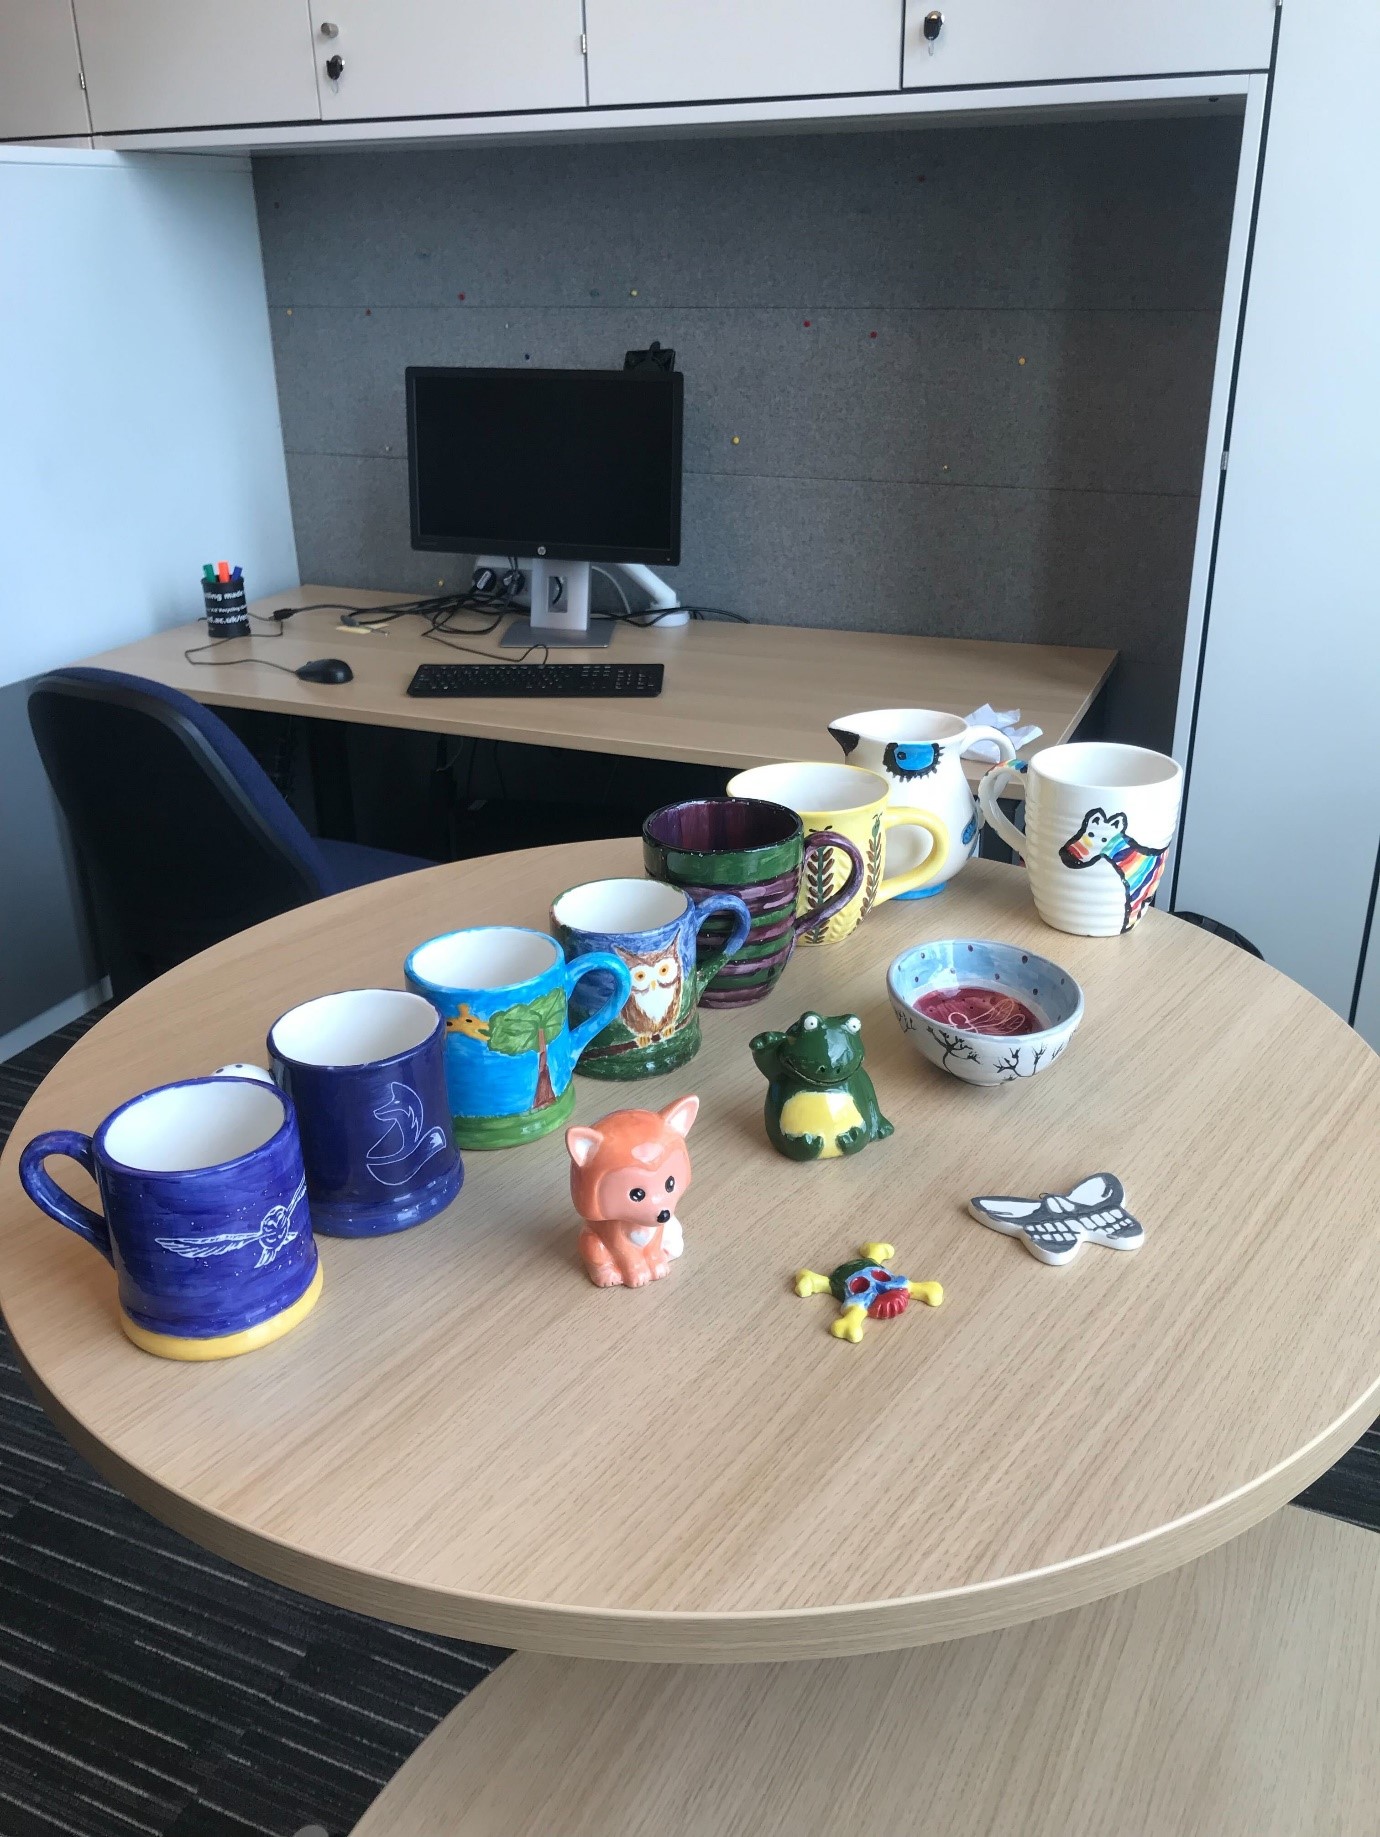
If the description of data as inert, manipulable, something we control were sufficient, we might have seen a lot of domestic data animals – cats and dogs, rabbits and rodents. Of these, there were none. Instead, we had a zebra and a giraffe, centipedes and dragonflies, frogs, foxes, owls, a death butterfly and a skull. Certainly, it seems that data are not tame in this group’s collective imagination!
So what did our data animals have to say about data? Riinu’s rainbow zebra shows the importance of reading between the lines; data analysis is not black and white and datasets are diverse, represented by the zebra’s rainbow stripes. Sarah’s giraffe represents the ability to use data for utilising resources that would otherwise be difficult to access (it’s also an animal in long-format). George’s frog follows an r-selection breeding strategy, otherwise known as an ‘r-strategist’: “this narrative is inspired by my approach to model selection – generating as many as one can sensibly think of and then whittling them down using natural selection/data metric driven selection”. Liz’s centipedes represent lots of quick-moving arms but overall, somewhat slow going; Annemarie’s death butterfly is superficially elegant and beautiful, but must be treated with respect as can be deadly if provoked or used badly. Ewen’s “ripped off owl jug” embodies imitation as the sincerest form of flattery: in data science, it is best to build on what has already been a success. Cath’s barn owl is a flash of light in the dark, but also eats other data animals for breakfast (sociologists of science and medicine can be a critical bunch). Ian’s animal is deceased and only the skull remains: “being the oldest member of the group I have datasets dead and buried all over Scotland…but a little bit of “data mining” might resurrect some of them?”
So: from sex and death to work and the constant striving for resources, social benefit and success, the data animals have it all. It would be disingenuous to suggest that the explanations we wove to account for our creations preceded the act of painting them; nonetheless, the stories we tell about data are an important way in which we relate to the world and the work that we do to make sense of it through research.
Often we think about data as an object: inert, manipulable, and something we control. We collect it, harvest it, scrape it, clean it, curate it, store it, share it, analyse it and display it. In these endeavours, we think about human agency and the work that we – as clinicians, statisticians, data scientists, sociologists – do to make sense of the world through quantified means. But what about the data themselves? What do they do? And what would it mean to give them agency? This is something that Science & Technology Studies scholars do routinely to underscore the ways in which the material world interacts with humans to create societal order. As a fun and playful way to think about some of the features of data that we identify with or relate to, we can ask, “If data were an animal, what would it be?”
After a full day and a half of talking about data at the strategy away day, it was time for people to get their hands dirty at Doodles pottery for some ‘team-building’. What better occasion to paint our own data animals! Everyone chose an item to paint: a mug, a jug, a bowl, and got to work dabbing, splatting, etching, and painting their designs. Creative activities like pottery painting are said to be good for team building because they nurture trust between colleagues; usually, everyone starts with minimal expertise, which is a good leveller, and everyone makes themselves a little bit vulnerable by putting their creations out into the world. This kind of activity also helps people get in touch with their inner artist and the parts of their brain responsible for creativity, imagination and intuition. This is the birth place of data animals!
If the description of data as inert, manipulable, something we control were sufficient, we might have seen a lot of domestic data animals – cats and dogs, rabbits and rodents. Of these, there were none. Instead, we had a zebra and a giraffe, centipedes and dragonflies, frogs, foxes, owls, a death butterfly and a skull. Certainly, it seems that data are not tame in this group’s collective imagination!
So what did our data animals have to say about data? Riinu’s rainbow zebra shows the importance of reading between the lines; data analysis is not black and white and datasets are diverse, represented by the zebra’s rainbow stripes. Sarah’s giraffe represents the ability to use data for utilising resources that would otherwise be difficult to access (it’s also an animal in long-format). George’s frog follows an r-selection breeding strategy, otherwise known as an ‘r-strategist’: “this narrative is inspired by my approach to model selection – generating as many as one can sensibly think of and then whittling them down using natural selection/data metric driven selection”. Liz’s centipedes represent lots of quick-moving arms but overall, somewhat slow going; Annemarie’s death butterfly is superficially elegant and beautiful, but must be treated with respect as can be deadly if provoked or used badly. Ewen’s “ripped off owl jug” embodies imitation as the sincerest form of flattery: in data science, it is best to build on what has already been a success. Cath’s barn owl is a flash of light in the dark, but also eats other data animals for breakfast (sociologists of science and medicine can be a critical bunch). Ian’s animal is deceased and only the skull remains: “being the oldest member of the group I have datasets dead and buried all over Scotland…but a little bit of “data mining” might resurrect some of them?”
So: from sex and death to work and the constant striving for resources, social benefit and success, the data animals have it all. It would be disingenuous to suggest that the explanations we wove to account for our creations preceded the act of painting them; nonetheless, the stories we tell about data are an important way in which we relate to the world and the work that we do to make sense of it through research.
